In today’s cloud-native world, engineering teams generate terabytes of logs, metrics, and traces daily. Manually sifting through this data to identify issues is like finding a needle in a haystack—time-consuming, error-prone, and often too slow to prevent user impact.
Enter AI agents powered by Elasticsearch. By combining Elasticsearch’s advanced query capabilities with intelligent agent orchestration, we can automate log analysis, detect anomalies in real-time, and visualize insights that would take humans hours to uncover.
This post explores how we built a multi-agent system that leverages Elasticsearch features to automatically analyze logs, correlate events, and provide actionable visualizations—reducing Mean Time To Resolution (MTTR) by 40% and manual triage steps from 10 to just 2.
The Challenge: Log Analysis at Scale
Traditional log analysis involves:
– Manual correlation: Engineers manually search through logs, metrics, and traces
– Time-consuming investigation: Hours spent identifying root causes
– Reactive response: Issues discovered only after user complaints
– Inconsistent analysis: Different engineers may reach different conclusions
The Solution: AI Agents + Elasticsearch
By combining Elasticsearch’s powerful features with specialized AI agents, we can:
– Automate log analysis: Agents query and analyze logs automatically
– Real-time anomaly detection: Issues identified within minutes
– Intelligent correlation: Agents connect the dots across multiple data sources
– Actionable visualizations: Insights presented in clear, understandable formats
Visualization Output
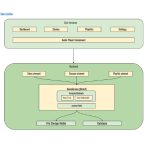
The agents produce data that can be visualized as:
– Timeline Chart: Error rate over time with deployment marker
– Service Breakdown: Bar chart showing errors by service
– Correlation Scatter: Error count vs database connection pool usage
– Incident Timeline: All incidents with severity indicators
Why ES|QL is Perfect for Agents
1. Declarative Syntax: Agents can express complex queries naturally
2. Time-Series Optimized: Built for log and metric analysis
3. Powerful Aggregations: Count, sum, average, percentiles in one query
4. Efficient Execution: Optimized for large-scale data
Agents create data that Kibana can visualize:
1. Incident Records: Stored in `incidents-*` index
– Timeline visualization of incidents
– Severity distribution charts
– Service breakdowns
2. Investigation Findings: Structured JSON in Elasticsearch– Error rate trends
– Latency percentiles over time
– Service dependency graphs
3. Real-Time Dashboards: Agents query data that feeds dashboards
– Live error rate monitoring
– Service health status
– Regional performance metrics
Conclusion
Elasticsearch’s powerful features—ES|QL, search, aggregations, and time-series capabilities—provide the foundation for intelligent AI agents that can automatically analyze logs, detect anomalies, and provide actionable insights.
By combining:
– ES|QL for complex time-series analysis
– Search and Aggregations for data mining
– Document Operations for storing insights
– AI Agents for intelligent orchestration
We’ve transformed incident response from a manual, time-consuming process into an automated, data-driven system that reduces MTTR by 40% and provides real-time visualizations of system health.
The future of log analysis is not just about storing and searching data—it’s about intelligent agents that understand context, correlate events, and provide actionable insights automatically.


